Section 4.10 Graphing Lines Chapter Review
Subsection 4.10.1 Cartesian Coordinates
In Section 4.1 we covered the definition of the Cartesian Coordinate System and how to plot points using the \(x\) and \(y\)-axes.
Example 4.10.1.
On paper, sketch a Cartesian coordinate system with units, and then plot the following points: \((3,2),(-5,-1),(0,-3),(4,0)\text{.}\)

Subsection 4.10.2 Graphing Equations
In Section 4.2 we covered how to find and plot solutions to equations, by choosing some reasonable \(x\)-values, calculating the corresponding \(y\)-values, plotting the \((x,y)\)-pairs as points and connecting the points with a smooth curve, to produce a graph of the equation.
Example 4.10.3.
Graph the equation \(y=-2x+5\text{.}\)
| \(x\) | \(y=-2x+5\) | Point |
| \(-2\) | \(\phantom{-2(-2)+5=\substitute{9}}\) | \(\phantom{(-2,9)}\) |
| \(-1\) | \(\phantom{-2(-1)+5=\substitute{7}}\) | \(\phantom{(-1,7)}\) |
| \(0\) | \(\phantom{-2(0)+5=\substitute{5}}\) | \(\phantom{(0,5)}\) |
| \(1\) | \(\phantom{-2(1)+5=\substitute{3}}\) | \(\phantom{(1,3)}\) |
| \(2\) | \(\phantom{-2(2)+5=\substitute{1}}\) | \(\phantom{(2,1)}\) |
| \(x\) | \(y=-2x+5\) | Point |
| \(-2\) | \(-2(-2)+5=\substitute{9}\) | \((-2,9)\) |
| \(-1\) | \(-2(-1)+5=\substitute{7}\) | \((-1,7)\) |
| \(0\) | \(-2(0)+5=\substitute{5}\) | \((0,5)\) |
| \(1\) | \(-2(1)+5=\substitute{3}\) | \((1,3)\) |
| \(2\) | \(-2(2)+5=\substitute{1}\) | \((2,1)\) |
We use points from the table to graph the equation. First, plot each point carefully. Then, connect the points with a smooth curve. Here, the curve is a straight line. Lastly, we can communicate that the graph extends further by sketching arrows on both ends of the line.


Subsection 4.10.3 Exploring Two-Variable Data and Rate of Change
In Section 4.3 we covered how to find patterns in tables of data and how to calculate the rate of change between points in data.
Exploring Two-Variable Data and Rate of Change.
For a linear relationship, by its data in a table, we can see the rate of change (slope) and the line's \(y\)-intercept, thus writing the equation.
Example 4.10.6.
Write an equation in the form \(y=\ldots\) suggested by the pattern in the table.
| \(x\) | \(y\) |
| \(0\) | \(-4\) |
| \(1\) | \(-6\) |
| \(2\) | \(-8\) |
| \(3\) | \(-10\) |
We consider how the values change from one row to the next. From row to row, the \(x\)-value increases by \(1\text{.}\) Also, the \(y\)-value decreases by \(2\) from row to row.
| \(x\) | \(y\) | ||
| \(0\) | \(-4\) | ||
| \({}+1\rightarrow\) | \(1\) | \(-6\) | \(\leftarrow{}-2\) |
| \({}+1\rightarrow\) | \(2\) | \(-8\) | \(\leftarrow{}-2\) |
| \({}+1\rightarrow\) | \(3\) | \(-10\) | \(\leftarrow{}-2\) |
Since row-to-row change is always \(1\) for \(x\) and is always \(-2\) for \(y\text{,}\) the rate of change from one row to another row is always the same: \(-2\) units of \(y\) for every \(1\) unit of \(x\text{.}\)
We know that the output for \(x = 0\) is \(y = -4\text{.}\) And our observation about the constant rate of change tells us that if we increase the input by \(x\) units from \(0\text{,}\) the ouput should decrease by \(\overbrace{(-2)+(-2)+\cdots+(-2)}^{x\text{ times}}\text{,}\) which is \(-2x\text{.}\) So the output would be \(-4-2x\text{.}\)
So the equation is \(y=-2x-4\text{.}\)
Subsection 4.10.4 Slope
In Section 4.4 we covered the definition of slope 4.4.2 and how to use slope-triangles to calculate slope. There is also the slope formula which helps find the slope through any two points.
Example 4.10.8.
Find the slope of the line in the following graph.


We picked two points on the line and then drew a slope triangle. Next, we will do:
The line's slope is \(4\text{.}\)
Example 4.10.11. Finding a Line's Slope by the Slope Formula.
Use the slope formula to find the slope of the line that passes through the points \((-5,25)\) and \((4,-2)\text{.}\)
The line's slope is \(-3\text{.}\)
Subsection 4.10.5 Slope-Intercept Form
In Section 4.5 we covered the definition of slope intercept-form and both wrote equations in slope-intercept form and graphed lines given in slope-intercept form.
Example 4.10.12.
Graph the line \(y=-\frac{5}{2}x+4\text{.}\)


Writing a Line's Equation in Slope-Intercept Form Based on Graph.
Given a line's graph, we can identify its \(y\)-intercept and then find its slope by a slope triangle. With a line's slope and \(y\)-intercept, we can write its equation in the form of \(y=mx+b\text{.}\)
Example 4.10.14.
Find the equation of the line in the graph.


With the line's slope \(-\frac{2}{3}\) and \(y\)-intercept \(10\text{,}\) we can write the line's equation in slope-intercept form: \(y=-\frac{2}{3}x+10\text{.}\)
Subsection 4.10.6 Point-Slope Form
In Section 4.6 we covered the definition of point-slope form and both wrote equations in point-slope form and graphed lines given in point-slope form.
Example 4.10.18.
A line passes through \((-6,0)\) and \((9,-10)\text{.}\) Find this line's equation in point-slope form.
We will use the slope formula to find the slope first. After labeling those two points as \((\overset{x_1}{-6},\overset{y_1}{0}) \text{ and } (\overset{x_2}{9},\overset{y_2}{-10})\text{,}\) we have:
Now the point-slope equation looks like \(y=-\frac{2}{3}(x-x_0)+y_0\text{.}\) Next, we will use \((9,-10)\) and substitute \(x_0\) with \(9\) and \(y_0\) with \(-10\text{,}\) and we have:
Subsection 4.10.7 Standard Form
In Section 4.7 we covered the definition of standard form of a linear equation. We converted equations from standard form to slope-intercept form and vice versa. We also graphed lines from standard form by finding the intercepts of the line.
Example 4.10.19.
Convert \(2x+3y=6\) into slope-intercept form.
Convert \(y=-\frac{4}{7}x-3\) into standard form.
-
\begin{align*} 2x+3y\amp=6\\ 2x+3y\subtractright{2x}\amp=6\subtractright{2x}\\ 3y\amp=-2x+6\\ \divideunder{3y}{3}\amp=\divideunder{-2x+6}{3}\\ y\amp=\frac{-2x}{3}+\frac{6}{3}\\ y\amp=-\frac{2}{3}x+2 \end{align*}
The line's equation in slope-intercept form is \(y=-\frac{2}{3}x+2\text{.}\)
-
\begin{align*} y\amp=-\frac{4}{7}x-3\\ \multiplyleft{7}y\amp=\multiplyleft{7}(-\frac{4}{7}x-3)\\ 7y\amp=7\cdot(-\frac{4}{7}x)-7\cdot3\\ 7y\amp=-4x-21\\ 7y\addright{4x}\amp=-4x-21\addright{4x}\\ 4x+7y\amp=-21 \end{align*}
The line's equation in standard form is \(4x+7y=-21\text{.}\)
To graph a line in standard form, we could first change it to slope-intercept form, and then graph the line by its \(y\)-intercept and slope triangles. A second method is to graph the line by its \(x\)-intercept and \(y\)-intercept, which is preferable when the \(y\)-intercept doesn't have an integer as its \(y\)-coordinate.
Example 4.10.20.
Graph \(2x-3y=-6\) using its intercepts. Then use the intercepts to calculate the line's slope.
We calculate the line's \(x\)-intercept by substituting \(y=0\) into the equation
So the line's \(x\)-intercept is \((-3,0)\text{.}\)
Similarly, we substitute \(x=0\) into the equation to calculate the \(y\)-intercept:
So the line's \(y\)-intercept is \((0,2)\text{.}\)
Let's find a checkpoint for this line by choosing \(x=-1\text{.}\) Notice that this \(x\) value falls between the \(x\)-coordinates of the two intercepts we've already found. Next, we plug that value in for \(x\) and solve for \(y\text{:}\)
So the checkpoint is \(\left(-1,\frac{4}{3}\right)\text{.}\)
With both the intercepts' and the checkpoint's coordinates, we can graph the line:

Now that we have graphed the line we can read the slope. The rise is 2 units and the run is 3 units so the slope is \(\frac{2}{3}\text{.}\)
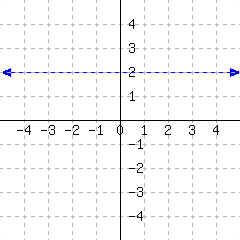
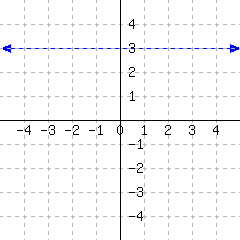
Subsection 4.10.8 Horizontal, Vertical, Parallel, and Perpendicular Lines
In Section 4.8 we covered what equations of horizontal and vertical lines. We also covered the relationships between the slopes of parallel and perpendicular lines.
Example 4.10.22.
Line \(m\)'s equation is \(y=-2x+20\text{.}\) Line \(n\) is parallel to \(m\) and line \(n\) also passes through the point \((4,-3)\text{.}\) Find an equation for line \(n\) in point slope form.
Since parallel lines have the same slope, line \(n\)'s slope is also \(-2\text{.}\) Since line \(n\) also passes the point \((4,-3)\text{,}\) we can write line \(n\)'s equation in point-slope form:
Two lines are perpendicular if and only if the product of their slopes is \(-1\text{.}\)
Example 4.10.23.
Line \(m\)'s equation is \(y=-2x+20\text{.}\) Line \(n\) is perpendicular to \(m\) and line \(q\) also passes through the point \((4,-3)\text{.}\) Find an equation for line \(q\) in slope intercept form.
Since line \(m\) and \(q\) are perpendicular, the product of their slopes is \(-1\text{.}\) Because line \(m\)'s slope is given as \(-2\text{,}\) we can find line \(q\)'s slope is \(\frac{1}{2}\text{.}\)
Since line \(q\) also passes the point \((4,-3)\text{,}\) we can write line \(q\)'s equation in point-slope form:
We can now convert this equation to slope-intercept form:
Exercises 4.10.9 Exercises
1.
Sketch the points \((8,2)\text{,}\) \((5,5)\text{,}\) \((-3,0)\text{,}\) \(\left(0,-\frac{14}{3}\right)\text{,}\) \((3,-2.5)\text{,}\) and \((-5,7)\) on a Cartesian plane.
2.
Locate each point in the graph:
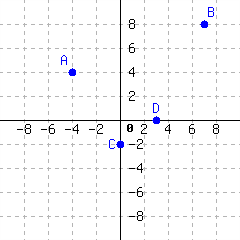
Write each point’s position as an ordered pair, like \((1,2)\text{.}\)
| \(A=\) | \(B=\) |
| \(C=\) | \(D=\) |
3.
Consider the equation
\(y=-\frac{3}{4} x-2\)
Which of the following ordered pairs are solutions to the given equation? There may be more than one correct answer.
\(\displaystyle (0,-2)\)
\(\displaystyle (12,-7)\)
\(\displaystyle (-12,7)\)
\(\displaystyle (-4,5)\)
4.
Consider the equation
\(y=-\frac{5}{6} x-2\)
Which of the following ordered pairs are solutions to the given equation? There may be more than one correct answer.
\(\displaystyle (-24,23)\)
\(\displaystyle (-18,13)\)
\(\displaystyle (0,-2)\)
\(\displaystyle (24,-17)\)
5.
Write an equation in the form \(y=\ldots\) suggested by the pattern in the table.
| \(x\) | \(y\) |
| \(0\) | \({-4}\) |
| \(1\) | \({-2}\) |
| \(2\) | \({0}\) |
| \(3\) | \({2}\) |
6.
Write an equation in the form \(y=\ldots\) suggested by the pattern in the table.
| \(x\) | \(y\) |
| \(0\) | \({3}\) |
| \(1\) | \({-2}\) |
| \(2\) | \({-7}\) |
| \(3\) | \({-12}\) |
7.
Below is a line’s graph.
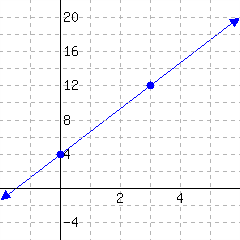
The slope of this line is .
8.
Below is a line’s graph.
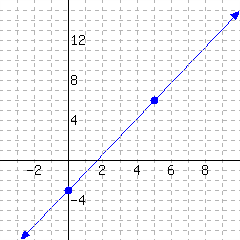
The slope of this line is .
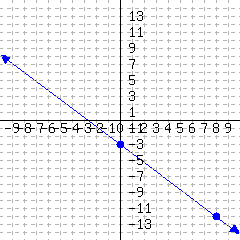
9.
Below is a line’s graph.
The slope of this line is .
10.
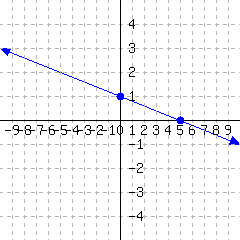
Below is a line’s graph.
The slope of this line is .
11.
A line passes through the points \((-24,{18})\) and \((24,{-12})\text{.}\) Find this line’s slope.
12.
A line passes through the points \((-12,{6})\) and \((8,{-19})\text{.}\) Find this line’s slope.
13.
A line passes through the points \((1,1)\) and \((-3,1)\text{.}\) Find this line’s slope.
14.
A line passes through the points \((5,3)\) and \((-1,3)\text{.}\) Find this line’s slope.
15.
A line passes through the points \((5,-3)\) and \((5,2)\text{.}\) Find this line’s slope.
16.
A line passes through the points \((8,-5)\) and \((8,4)\text{.}\) Find this line’s slope.
17.
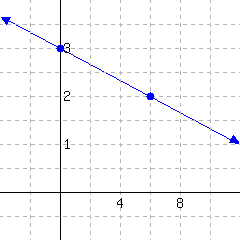
A line’s graph is given. What is this line’s slope-intercept equation?
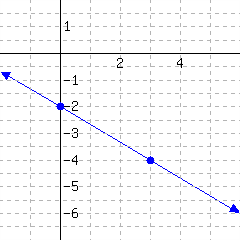
18.
A line’s graph is given. What is this line’s slope-intercept equation?
19.
Find the line’s slope and \(y\)-intercept.
A line has equation \(\displaystyle{ 2x-3y=15 }\text{.}\)
This line’s slope is .
This line’s \(y\)-intercept is .
20.
Find the line’s slope and \(y\)-intercept.
A line has equation \(\displaystyle{ 7x-4y=-4 }\text{.}\)
This line’s slope is .
This line’s \(y\)-intercept is .
21.
A line passes through the points \((-10,{-17})\) and \((-15,{-21})\text{.}\) Find this line’s equation in point-slope form.
22.
A line passes through the points \((-4,{-15})\) and \((0,{-5})\text{.}\) Find this line’s equation in point-slope form.
23.
Scientists are conducting an experiment with a gas in a sealed container. The mass of the gas is measured, and the scientists realize that the gas is leaking over time in a linear way. Each minute, they lose 7.1 grams. minutes since the experiment started, the remaining gas had a mass of 269.8 grams.
Let \(x\) be the number of minutes that have passed since the experiment started, and let \(y\) be the mass of the gas in grams at that moment. Use a linear equation to model the weight of the gas over time.
Find this line’s slope-intercept equation.
35 minutes after the experiment started, how many grams of gas would be left?
If a linear model continues to be accurate, after how many minutes since the experiment started will all gas in the container will be gone?
24.
Scientists are conducting an experiment with a gas in a sealed container. The mass of the gas is measured, and the scientists realize that the gas is leaking over time in a linear way. Each minute, they lose 4 grams. minutes since the experiment started, the remaining gas had a mass of 172 grams.
Let \(x\) be the number of minutes that have passed since the experiment started, and let \(y\) be the mass of the gas in grams at that moment. Use a linear equation to model the weight of the gas over time.
Find this line’s slope-intercept equation.
35 minutes after the experiment started, how many grams of gas would be left?
If a linear model continues to be accurate, after how many minutes since the experiment started will all gas in the container will be gone?
25.
Find the \(y\)-intercept and \(x\)-intercept of the line given by the equation. If a particular intercept does not exist, enter none into all the answer blanks for that row.
| \(x\)-value | \(y\)-value | Location (as an ordered pair) | |
| \(y\)-intercept | |||
| \(x\)-intercept |
26.
Find the \(y\)-intercept and \(x\)-intercept of the line given by the equation. If a particular intercept does not exist, enter none into all the answer blanks for that row.
| \(x\)-value | \(y\)-value | Location (as an ordered pair) | |
| \(y\)-intercept | |||
| \(x\)-intercept |
27.
Find the line’s slope and \(y\)-intercept.
A line has equation \(\displaystyle{ -{2}x+y= -5 }\text{.}\)
This line’s slope is .
This line’s \(y\)-intercept is .
28.
Find the line’s slope and \(y\)-intercept.
A line has equation \(\displaystyle{ -x-y= -7 }\text{.}\)
This line’s slope is .
This line’s \(y\)-intercept is .
29.
Find the line’s slope and \(y\)-intercept.
A line has equation \(\displaystyle{ 6x+9y=5 }\text{.}\)
This line’s slope is .
This line’s \(y\)-intercept is .
30.
Find the line’s slope and \(y\)-intercept.
A line has equation \(\displaystyle{ 6x+8y=3 }\text{.}\)
This line’s slope is .
This line’s \(y\)-intercept is .
31.
Fill out this table for the equation \(x=-5\text{.}\) The first row is an example.
| \(x\) | \(y\) | Points |
| \(-5\) | \(-3\) | \(\left(-5,-3\right)\) |
| \(-2\) | ||
| \(-1\) | ||
| \(0\) | ||
| \(1\) | ||
| \(2\) |
32.
Fill out this table for the equation \(x=-4\text{.}\) The first row is an example.
| \(x\) | \(y\) | Points |
| \(-4\) | \(-3\) | \(\left(-4,-3\right)\) |
| \(-2\) | ||
| \(-1\) | ||
| \(0\) | ||
| \(1\) | ||
| \(2\) |
33.
A line’s graph is shown. Write an equation for the line.
34.
A line’s graph is shown. Write an equation for the line.
35.
Line \(m\) passes points \((10,0)\) and \((10,4)\text{.}\)
Line \(n\) passes points \((4,-3)\) and \((4,-2)\text{.}\)
These two lines are
parallel
perpendicular
neither parallel nor perpendicular
36.
Line \(m\) passes points \((-9,-7)\) and \((-9,-9)\text{.}\)
Line \(n\) passes points \((-2,-3)\) and \((-2,9)\text{.}\)
These two lines are
parallel
perpendicular
neither parallel nor perpendicular