Section 4.4 Slope
In Section 4.3, we observed that a constant rate of change between points produces a linear relationship, whose graph is a straight line. Such a constant rate of change has a special name, slope, and we'll explore slope in more depth here.
Subsection 4.4.1 What is slope?
When the rate of change from point to point never changes, those points must fall on a straight line, as in Figure 4.4.1, and there is a linear relationship between the variables \(x\) and \(y\text{.}\)
Rather than say “constant rate of change” in every such situation, mathematicians call that common rate of change slope.

Definition 4.4.2. Slope.
When \(x\) and \(y\) are two variables where the rate of change between any two points is always the same, we call this common rate of change the slope. Since having a constant rate of change means the graph will be a straight line, its also called the slope of the line.
Considering the definition for Definition 4.3.11, this means that when \(x\) and \(y\) are two variables where the rate of change between any two points is always the same, then you can calculate slope, \(m\text{,}\) by finding two distinct data points \((x_1,y_1)\) and \((x_2,y_2)\text{,}\) and calculating
A slope is a rate of change. So if there are units for the horizontal and vertical variables, then there will be units for the slope. The slope will be measured in \(\frac{\text{vertical units}}{\text{horizontal units}}\text{.}\)
If the slope is nonzero, we say that there is a linear relationship between \(x\) and \(y\text{.}\) When the slope is \(0\text{,}\) we say that \(y\) is constant with respect to \(x\text{.}\)
Here are some scenarios with different slopes. Note that a slope is more meaningful with units.
If a tree grows \(2.5\) feet every year, its rate of change in height is the same from year to year. So the height and time have a linear relationship where the slope is 2.5 ft⁄yr.
If a company loses \(2\) million dollars every year, its rate of change in reserve funds is the same from year to year. So the company's reserve funds and time have a linear relationship where the slope is \(-2\) million dollars per year.
If Sakura is an adult who has stopped growing, her rate of change in height is the same from year to year—it's zero. So the slope is 0 in⁄yr. Sakura's height is constant with respect to time. In a statistics course, you would say that height and time don't have a relationship at all, in the sense that information about Sakura's height tells you nothing about her age.
Remark 4.4.3.
A useful phrase for remembering the definition of slope is “rise over run.” Here, “rise” refers to “change in \(y\text{,}\)” \(\Delta y\text{,}\) and “run” refers to “change in \(x\text{,}\)” \(\Delta x\text{.}\) Be careful though. As we have learned, the horizontal direction comes first in mathematics, followed by the vertical direction. The phrase “rise over run” reverses this. (It's a bit awkward to say, but the phrase “run under rise” puts the horizontal change first.)
Example 4.4.4. Yara's Savings.
On Dec. 31, Yara had only \(\$50\) in her savings account. For the the new year, she resolved to deposit \(\$20\) into her savings account each week, without withdrawing any money from the account.
Yara keeps her resolution, and her account balance increases steadily by \(\$20\) each week. That's a constant rate of change, so her account balance and time have a linear relationship with slope \(20\, \sfrac{\text{dollars}}{\text{wk}}\text{.}\)
We can model the balance, \(y\text{,}\) in Yara's savings account after \(x\) weeks with an equation. Since Yara started with \(\$50\) and adds \(\$20\) each week, the account balance \(y\) after \(x\) weeks is
where \(y\) is a dollar amount. Notice that the slope, \(20\, \sfrac{\text{dollars}}{\text{wk}}\text{,}\) serves as the multiplier for \(x\) weeks.
We can also consider Yara's savings using a table.
| \(x\text{,}\) weeks since Dec. 31 |
\(y\text{,}\) savings account balance (dollars) |
||
| \(0\) | \(50\) | ||
| \(x\) increases by \(1\)\(\longrightarrow\) | \(1\) | \(70\) | \(\longleftarrow\)\(y\) increases by \(20\) |
| \(x\) increases by \(1\)\(\longrightarrow\) | \(2\) | \(90\) | \(\longleftarrow\)\(y\) increases by \(20\) |
| \(x\) increases by \(2\)\(\longrightarrow\) | \(4\) | \(130\) | \(\longleftarrow\)\(y\) increases by \(40\) |
| \(x\) increases by \(3\)\(\longrightarrow\) | \(7\) | \(190\) | \(\longleftarrow\)\(y\) increases by \(60\) |
| \(x\) increases by \(5\)\(\longrightarrow\) | \(12\) | \(290\) | \(\longleftarrow\)\(y\) increases by \(100\) |
In first few rows of the table, we see that when the number of weeks \(x\) increases by \(1\text{,}\) the balance \(y\) increases by \(20\text{.}\) The row-to-row rate of change is \(\frac{20}{1} = 20\text{,}\) the slope. In any table for a linear relationship, whenever \(x\) increases by \(1\) unit, \(y\) will increase by the slope.
In further rows, notice that as row-to-row change in \(x\) increases, row-to-row change in \(y\) increases proportionally to preserve the constant rate of change. Looking at the change in the last two rows of the table, we see \(x\) increases by \(5\) and \(y\) increases by \(100\text{,}\) which gives a rate of change of \(\frac{100}{5} = 20\text{,}\) the value of the slope again.
We can “see” the rates of change between consecutive rows of the table on a graph of Yara's savings by including slope triangles.

The large, labeled slope triangle indicates that when \(5\) weeks pass, Yara saves \(\$100\text{.}\) This is the rate of change between the last two rows of the table, \(\frac{100}{5} = 20 \, \sfrac{\text{dollars}}{\text{wk}}\text{.}\)
The smaller slope triangles indicate, from left to right, the rates of change \(\frac{20}{1}\text{,}\) \(\frac{20}{1}\text{,}\) \(\frac{40}{2}\text{,}\) and \(\frac{60}{3}\) respectively. All of these rates simplify to the slope, \(20 \, \sfrac{\text{dollars}}{\text{wk}}\text{.}\)
Every slope triangle on the graph of Yara's savings has the same shape (geometrically, they are called similar triangles) since the ratio of vertical change to horizontal change is always \(20 \, \sfrac{\text{dollars}}{\text{wk}}\text{.}\) On any graph of any line, we can draw a slope triangle and compute slope as “rise over run.”
Of course, we could draw a slope triangle on the other side of the line:

This slope triangle works just as well for identifying “rise” and “run”, but it focuses on vertical change before horizontal change. For consistency with mathematical conventions, we will generally draw slope triangles showing horizontal change followed by vertical change, as in Figure 4.4.6.
Example 4.4.8.
The following graph of a line models the amount of gas, in gallons, in Kiran's gas tank as they drive their car. Find the line's slope, and interpret its meaning in this context.

To find a line's slope using its graph, we first identify two points on it, and then draw a slope triangle. Naturally, we would want to choose two points whose \(x\)- and \(y\)-coordinates are easy to identify exactly based on the graph.
We will pick the two points where \(x=3\) and \(x=6\text{,}\) because they are right on the grid lines:

Notice that the change in \(y\) is negative, because the amount of gas is decreasing. Since we chose points with integer coordinates, we can easily calculate the slope:
With units, the slope is \(-\frac{2}{3}\)gal⁄h.
In the given context, this slope implies gas in the tank is decreasing at the rate of \(\frac{2}{3}\)gal⁄h. Since this slope is written as a fraction, there is another way to understand it: the gas in Kiran's tank is decreasing by \(2\) gallons every \(3\) hours.
Checkpoint 4.4.11.
Checkpoint 4.4.12.
Subsection 4.4.2 Comparing Slopes
It's useful to understand what it means for different slopes to appear on the same coordinate system.
Example 4.4.13.
Effie, Iva, and Cleo are in a foot race. Figure 4.4.14 models the distance each has traveled in the first few seconds. Each runner takes a second to accelerate up to their running speed, but then runs at a constant speed. So they are then traveling with a constant rate of change, and the straight line portions of their graphs have a slope. Find each line's slope, and interpret its meaning in this context. What comparisons can you make with these runners?

We will draw slope triangles to find each line's slope.


Using Formula (4.4.1), we have:
- Effie's slope is \(\frac{8}{3}\approx2.667\) meters per second
- Ivan's slope is \(\frac{7}{2}=3.5\) meters per second
- Cleo's slope is \(\frac{8}{2}=4\) meters per second
In a time-distance graph, the slope of a line represents speed. The slopes in these examples and the running speeds of these runners are both measured in m⁄s. Another important relationship we can see is that, the more sharply a line is slanted, the bigger the slope is. This should make sense because for each passing second, the faster person travels a longer distance, making a slope triangle's height taller. This means that, numerically, we can tell that Cleo is the fastest runner (and Effie is the slowest) just by comparing the slopes \(4>3.5>2.667\text{.}\)
Checkpoint 4.4.16. Jogging on Mt. Hood.
Some important properties are demonstrated in Exercise 4.4.16.
Fact 4.4.17. The Relationship Between Slope and Increase/Decrease.
In a linear relationship, as the \(x\)-value increases (in other words as you read its graph from left to right):
- if the \(y\)-values increase (in other words, the line goes upward), its slope is positive.
- if the \(y\)-values decrease (in other words, the line goes downward), its slope is negative.
- if the \(y\)-values don't change (in other words, the line is flat, or horizontal), its slope is \(0\text{.}\)
These properties are summarized graphically in Figure 4.4.18.


Subsection 4.4.3 Finding Slope by Two Given Points
Several times in this section we computed a slope by drawing a slope triangle. That's not really necessary if you have coordinates for two points that a line passes through. In fact, sometimes it's impractical to draw a slope triangle. 1 Here we will stress how to find a line's slope without drawing a slope triangle.
Example 4.4.19.
Your neighbor planted a sapling from Portland Nursery in his front yard. Ever since, for several years now, it has been growing at a constant rate. By the end of the third year, the tree was 15 ft tall; by the end of the sixth year, the tree was 27 ft tall. What's the tree's rate of growth (i.e. the slope)?
We could sketch a graph for this scenario, and include a slope triangle. If we did that, it would look like:

By the slope triangle and Equation (4.4.1) we have:
So the tree is growing at a rate of 4 ft⁄yr.
But hold on. Did we really need this picture? The “rise” of \(12\) came from a subtraction of two \(y\)-values: \(27-15\text{.}\) And the “run” of \(3\) came from a subtraction of two \(x\)-values: \(6-3\text{.}\)
Here is a picture-free approach. We know that after 3 yr, the height is 15 ft. As an ordered pair, that information gives us the point \((3,15)\text{,}\) which we can label as \((\overset{x_1}{3},\overset{y_1}{15})\text{.}\) Similarly, the background information tells us to consider \((6,27)\text{,}\) which we label as \((\overset{x_2}{6},\overset{y_2}{27})\text{.}\) Here, \(x_1\) and \(y_1\) represent the first point's \(x\)-value and \(y\)-value, and \(x_2\) and \(y_2\) represent the second point's \(x\)-value and \(y\)-value.
It's important to use a subscript instead of a superscript here, because \(y^2\) means to take the number \(y\) and square it. Whereas \(y_2\) tells you that there are at least two \(y\)-values in the conversation, and \(y_2\) is the second of them.
Now we can write an alternative to Equation (4.4.1):
This is known as the slope formula. The following graph will help you understand why this formula works. Basically, we are still using a slope triangle to calculate the slope.


It's important to use subscript instead of superscript in the slope equation, because \(y^2\) means to take the number \(y\) and square it. Whereas \(y_2\) tells you that there are at least two \(y\)-values in the conversation, and \(y_2\) is the second of them.
The beauty of the slope formula is that to find a line's slope, we don't need to draw a slope triangle any more. Let's look at an example.
Example 4.4.22.
A line passes the points \((-5,25)\) and \((4,-2)\text{.}\) Find this line's slope.
If you are new to this formula, it's important to label each number before using the formula. The two given points are:
Now apply the slope formula:
Note that we used parentheses when substituting in \(x_1\) and \(y_1\text{.}\) This is a good habit to protect yourself from making errors with subtraction and double negatives.
Checkpoint 4.4.23.
Exercises 4.4.4 Exercises
Review and Warmup
1.
Reduce the fraction \(\displaystyle{ \frac{2}{12} }\text{.}\)
2.
Reduce the fraction \(\displaystyle{ \frac{5}{30} }\text{.}\)
3.
Reduce the fraction \(\displaystyle{ \frac{20}{35} }\text{.}\)
4.
Reduce the fraction \(\displaystyle{ \frac{12}{21} }\text{.}\)
5.
Reduce the fraction \(\displaystyle{ \frac{24}{54} }\text{.}\)
6.
Reduce the fraction \(\displaystyle{ \frac{70}{84} }\text{.}\)
7.
Reduce the fraction \(\displaystyle{ \frac{120}{70} }\text{.}\)
8.
Reduce the fraction \(\displaystyle{ \frac{120}{75} }\text{.}\)
9.
Reduce the fraction \(\displaystyle{ \frac{30}{6} }\text{.}\)
10.
Reduce the fraction \(\displaystyle{ \frac{126}{21} }\text{.}\)
11.
Simplify the following.
\(\frac{-49}{-7}\)
\(\frac{28}{-4}\)
\(\frac{-40}{5}\)
Slope and Points
12.
A line passes through the points \((2,1)\) and \((7,16)\text{.}\) Find this line’s slope.
13.
A line passes through the points \((4,24)\) and \((6,32)\text{.}\) Find this line’s slope.
14.
A line passes through the points \((1,-1)\) and \((10,-19)\text{.}\) Find this line’s slope.
15.
A line passes through the points \((3,-9)\) and \((8,-14)\text{.}\) Find this line’s slope.
16.
A line passes through the points \((-1,2)\) and \((-7,-28)\text{.}\) Find this line’s slope.
17.
A line passes through the points \((-3,-3)\) and \((-5,-5)\text{.}\) Find this line’s slope.
18.
A line passes through the points \((-1,-3)\) and \((3,-19)\text{.}\) Find this line’s slope.
19.
A line passes through the points \((-4,14)\) and \((2,2)\text{.}\) Find this line’s slope.
20.
A line passes through the points \((-2,5)\) and \((-8,23)\text{.}\) Find this line’s slope.
21.
A line passes through the points \((-4,4)\) and \((-5,7)\text{.}\) Find this line’s slope.
22.
A line passes through the points \((15,{20})\) and \((-5,{-4})\text{.}\) Find this line’s slope.
23.
A line passes through the points \((5,{13})\) and \((-15,{-11})\text{.}\) Find this line’s slope.
24.
A line passes through the points \((-6,{22})\) and \((6,{-32})\text{.}\) Find this line’s slope.
25.
A line passes through the points \((-8,{17})\) and \((8,{-1})\text{.}\) Find this line’s slope.
26.
A line passes through the points \((2,-9)\) and \((-5,-9)\text{.}\) Find this line’s slope.
27.
A line passes through the points \((1,-7)\) and \((-3,-7)\text{.}\) Find this line’s slope.
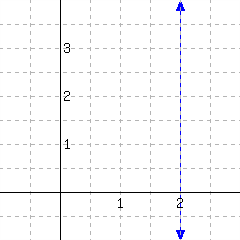
28.
A line passes through the points \((-4,-2)\) and \((-4,5)\text{.}\) Find this line’s slope.
29.
A line passes through the points \((-2,-4)\) and \((-2,2)\text{.}\) Find this line’s slope.
Slope and Graphs
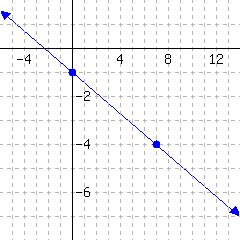
30.
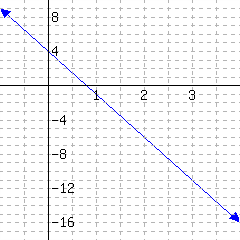
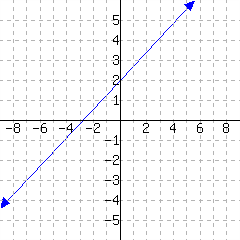
Below is a line’s graph.
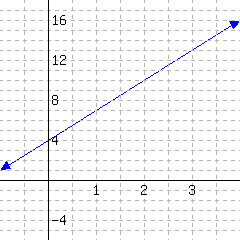
The slope of this line is .
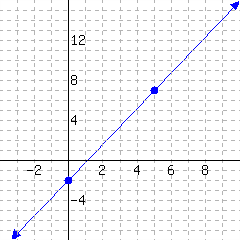
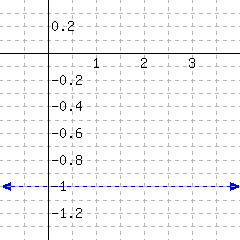
31.
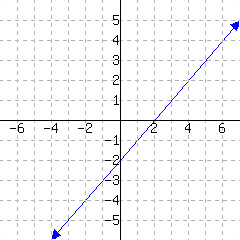
Below is a line’s graph.
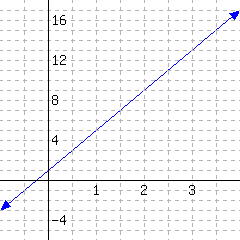
The slope of this line is .
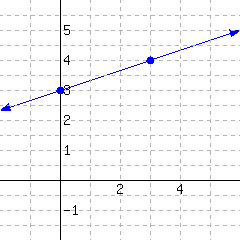
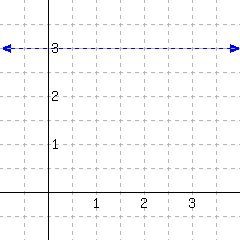
32.
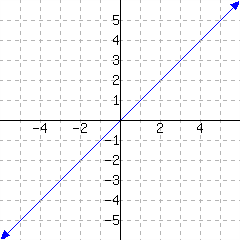
Below is a line’s graph.
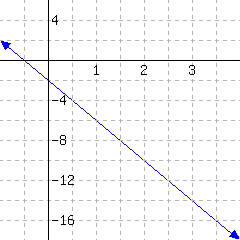
The slope of this line is .
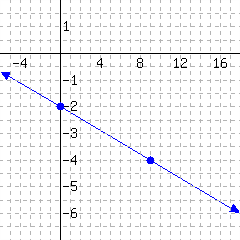
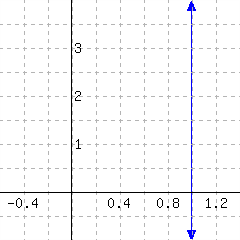
33.
Below is a line’s graph.
The slope of this line is .
34.
Below is a line’s graph.
The slope of this line is .
35.
Below is a line’s graph.
The slope of this line is .
36.
Below is a line’s graph.
The slope of this line is .
37.
Below is a line’s graph.
The slope of this line is .
38.
Below is a line’s graph.
The slope of this line is .
39.
Below is a line’s graph.
The slope of this line is .
40.
Below is a line’s graph.
The slope of this line is .
41.
Below is a line’s graph.
The slope of this line is .
42.
Below is a line's graph.
The slope of this line is .
43.
Below is a line's graph.
The slope of this line is .
44.
Below is a line's graph.
The slope of this line is .
Slope in Context
45.
By your cell phone contract, you pay a monthly fee plus some money for each minute you use the phone during the month. In one month, you spent \(210\) minutes on the phone, and paid \({\$22.25}\text{.}\) In another month, you spent \(330\) minutes on the phone, and paid \({\$25.25}\text{.}\) What is the rate (in dollars per minute) that the phone company is charging you? That is, what is the slope of the line if you plotted the bill versus the number of minutes spent on the phone?
The rate is per minute.
46.
By your cell phone contract, you pay a monthly fee plus some money for each minute you use the phone during the month. In one month, you spent \(250\) minutes on the phone, and paid \({\$20.25}\text{.}\) In another month, you spent \(400\) minutes on the phone, and paid \({\$24.00}\text{.}\) What is the rate (in dollars per minute) that the phone company is charging you? That is, what is the slope of the line if you plotted the bill versus the number of minutes spent on the phone?
The rate is per minute.
47.
A company set aside a certain amount of money in the year 2000. The company spent exactly the same amount from that fund each year on perks for its employees. In \(2004\text{,}\) there was still \({\$500{,}000}\) left in the fund. In \(2006\text{,}\) there was \({\$436{,}000}\) left. What is the rate (in dollars per year) at which this company is spending from this fund?
The company is spending per year on perks for its employees.
48.
A company set aside a certain amount of money in the year 2000. The company spent exactly the same amount from that fund each year on perks for its employees. In \(2002\text{,}\) there was still \({\$820{,}000}\) left in the fund. In \(2006\text{,}\) there was \({\$680{,}000}\) left. What is the rate (in dollars per year) at which this company is spending from this fund?
The company is spending per year on perks for its employees.
49.
A biologist has been observing a tree’s height. Fourteen months into the observation, the tree was \(17.08\) feet tall. Sixteen months into the observation, the tree was \(17.52\) feet tall. What is the rate at which the tree is growing? In other words, what is the slope if you plotted height versus time?
50.
A biologist has been observing a tree’s height. Ten months into the observation, the tree was \(13.7\) feet tall. Twenty months into the observation, the tree was \(16.2\) feet tall. What is the rate at which the tree is growing? In other words, what is the slope if you plotted height versus time?
51.
Scientists are conducting an experiment with a gas in a sealed container. The mass of the gas is measured, and the scientists realize that the gas is leaking over time in a linear way. Eight minutes since the experiment started, the gas had a mass of \(291.1\) grams. Sixteen minutes since the experiment started, the gas had a mass of \(234.3\) grams. At what rate is the gas leaking?
52.
Scientists are conducting an experiment with a gas in a sealed container. The mass of the gas is measured, and the scientists realize that the gas is leaking over time in a linear way. Ten minutes since the experiment started, the gas had a mass of \(160\) grams. Thirteen minutes since the experiment started, the gas had a mass of \(148\) grams. At what rate is the gas leaking?
53.
A liquid solution is slowly leaking from a container. This graph shows the
milliters of solution \(y\) remaining in the container after \(x\) minutes.
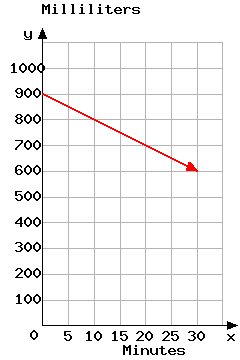
a. The \(y\) coordinate of the line is .
b. The slope of the line is .
c. Use the graph and your answer to part b to predict the number of minutes it will take for the container to empty if the solution continues leaking at the same rate. That time is minutes.
54.
The graph plots the number of invasive cancer diagnoses in Oregon over time, and a trend-line has been drawn.
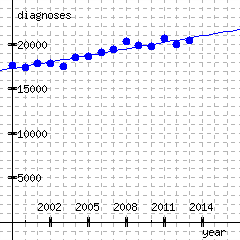
Estimate the slope of the trend-line. Just give the numerical value; the units are provided.
\(\,\frac{\text{diagnoses}}{\text{year}}\)